There is a moment every IT operations leader knows well. It is 2am. A critical application is degraded. The monitoring dashboard shows hundreds of alerts, all firing simultaneously. The on-call engineer is scrolling through a wall of red, trying to determine which alert actually matters and which are downstream noise from a single upstream failure nobody has identified yet.
This is not a technology problem. It is an information architecture problem. And it is the reason the enterprise IT operations market has undergone its most significant transformation in a decade.
The shift from monitoring — knowing that something is wrong — to observability — understanding why it is wrong — is redefining how IT operations teams are structured, tooled, and measured. Combined with the adoption of AI-driven operations platforms that correlate signals across the entire technology stack, the discipline of IT operations is moving from reactive firefighting to predictive engineering.
What IT Operations Actually Covers
IT operations is the discipline responsible for keeping IT services running — managing the infrastructure, platforms, and applications that the business depends on. It spans everything from the physical and virtual infrastructure layer through to the user experience of every application.
Within operations, observability has emerged as the defining capability. Where traditional monitoring asks "is this thing up or down?", observability asks "what is this system doing, why is it behaving that way, and what is going to happen next?" The distinction matters because modern distributed systems — microservices, containers, serverless functions, multi-cloud deployments — fail in ways that simple monitoring cannot detect.
Four sub-domains define the current state of enterprise IT operations: AIOps, observability platforms, IT Service Management, and automation.
Why Operations Is Harder Than It Was Five Years Ago
Three forces have made enterprise IT operations dramatically more complex.
The explosion of signals. A typical enterprise now generates billions of log lines, millions of metrics, and hundreds of thousands of events per day across its technology stack. The volume of raw data has grown faster than any human team's ability to process it. Traditional monitoring tools — built for a world of dozens of servers — are not designed for this scale.
The shift to distributed architectures. Microservices and containerised applications have replaced monolithic systems. A single customer transaction may now touch dozens of services, each with its own logs and metrics, deployed across multiple clouds and runtime environments. A failure in one service creates cascading effects that are almost impossible to trace without purpose-built observability tooling.
The compression of acceptable downtime. Business tolerance for service degradation has collapsed. Organisations that accepted minutes of downtime five years ago now measure impact in seconds. The expectation of always-on digital services has transferred the pressure from IT operations teams to the tools and platforms they use — making the capability gap between leading and lagging operations teams increasingly visible.
The Sub-Domains That Matter Most
AIOps
AIOps — Artificial Intelligence for IT Operations — uses machine learning to correlate, analyse, and act on the signal volume that exceeds human capacity to process manually. The core capabilities are noise reduction (suppressing redundant alerts), root cause isolation (identifying the actual source of an incident from its symptoms), and predictive analytics (identifying anomalies before they become incidents).
The practical impact is significant. Organisations that have implemented mature AIOps platforms report reductions in mean time to detect (MTTD) of 50-70% and mean time to resolve (MTTR) of 30-50%. The reduction in alert noise alone — from thousands of alerts to dozens of meaningful incidents — changes the operational model fundamentally.
Gartner defines AIOps as a platform capability rather than a standalone product. The leading observability platforms (Dynatrace, Datadog, New Relic) have embedded AIOps capabilities into their core product, while pure-play AIOps vendors (Moogsoft, BigPanda) have been largely absorbed by or partnered with broader observability platforms.
Observability
Observability is the ability to understand the internal state of a system from its external outputs. The three pillars of observability are logs (records of events), metrics (numerical measurements over time), and traces (the path of a request through distributed services). Modern observability platforms unify all three and add a fourth — user experience monitoring — to complete the picture from infrastructure to end user.
The OpenTelemetry project has become the industry standard for collecting observability data, providing vendor-neutral instrumentation that allows organisations to send telemetry to any compatible backend. This has reduced vendor lock-in concerns and accelerated adoption.
IT Service Management
ITSM platforms — led by ServiceNow — have evolved from workflow tools for managing IT tickets into platforms that sit at the centre of IT operations. The integration of ITSM with observability (automatically creating incidents from alerts), with configuration management (understanding what changed), and with change management (controlling what changes) has created a new category: IT Operations Management (ITOM).
ServiceNow's ITOM products — Event Management, Service Graph (CMDB), and Cloud Provisioning — represent the most complete enterprise ITSM-plus-operations platform. Competitors including Jira Service Management (Atlassian), BMC Helix, and Freshservice occupy different segments of the market.
IT Automation
Automation is the mechanism that converts observability intelligence into action — remediation without human intervention for known failure patterns, self-healing infrastructure, and automated runbook execution. The tools in this space range from Ansible and Terraform (infrastructure automation) to purpose-built runbook automation platforms (PagerDuty Process Automation, Rundeck) to the automation engines embedded in observability platforms.
The maturity model for IT automation progresses from manual execution, through assisted automation (human-triggered scripts), to supervised automation (human approval required), to fully autonomous remediation. Most enterprises are in the assisted-to-supervised range; fully autonomous remediation for production services remains relatively rare.
The Gartner Magic Quadrant Landscape
APM and Observability MQ
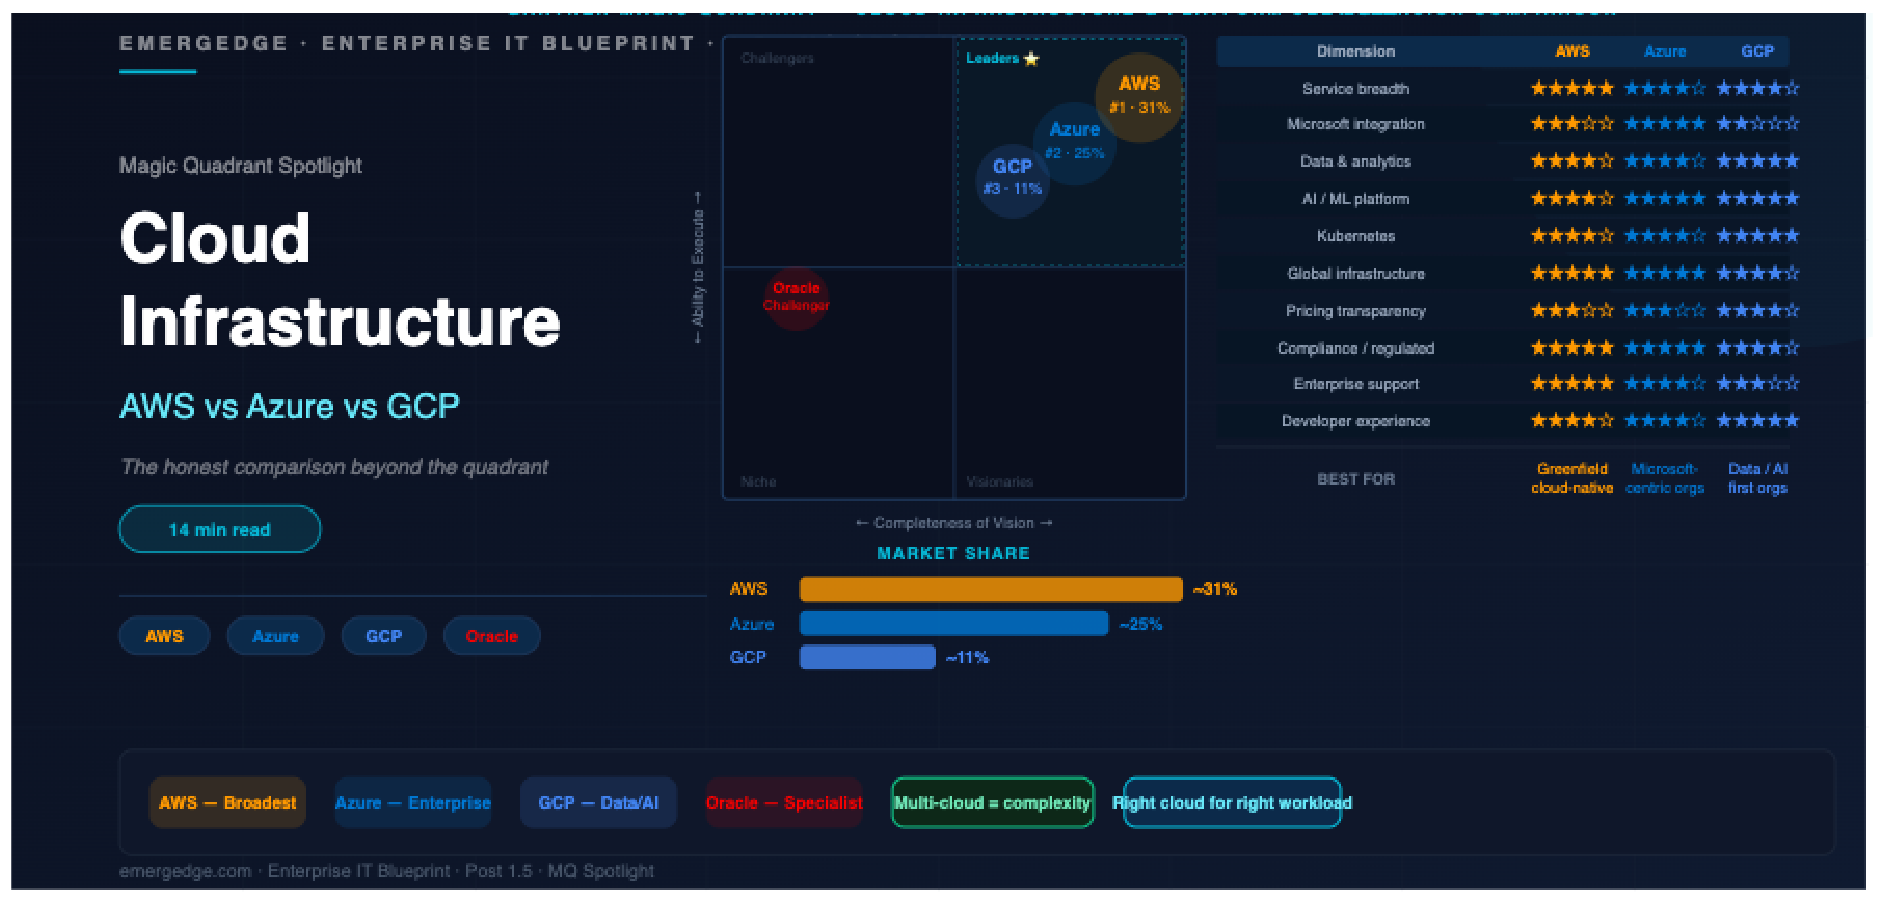
Gartner's Magic Quadrant for Application Performance Monitoring and Observability consistently identifies three Leaders: Dynatrace, Datadog, and New Relic.
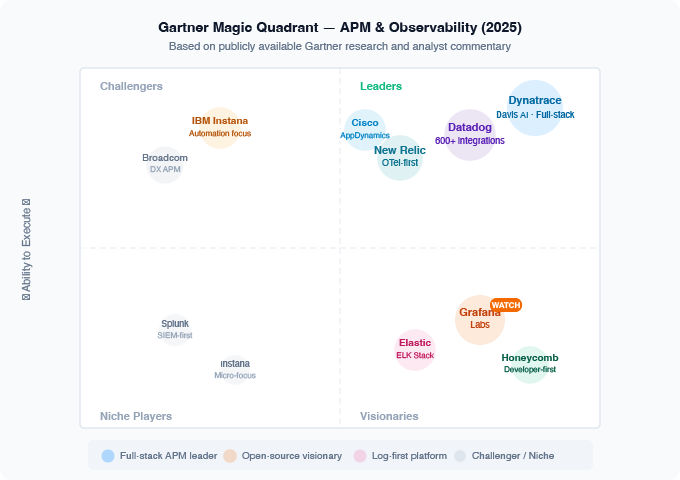
Cisco (AppDynamics) holds a Leader position with strong enterprise penetration but slower innovation velocity. Elastic and Grafana Labs occupy Challenger and Visionary positions respectively with strong open-source communities.
The defining differentiator in the Leaders quadrant is the degree to which AI is embedded in the platform — not as a feature but as the core operational model. Dynatrace's Davis AI engine and Datadog's watchdog AI both automate root cause analysis at a level that reduces alert noise by over 90% in well-instrumented environments.
ITSM MQ
Gartner's Magic Quadrant for ITSM consistently identifies ServiceNow as the dominant Leader — operating at a different scale to all competitors in the enterprise segment. Jira Service Management (Atlassian) is the strongest challenger, having moved aggressively upmarket from its developer-tool origins. BMC Helix, Ivanti, and Freshservice serve different enterprise segments.
Vendor Comparison
| Dimension | Dynatrace | Datadog | New Relic | ServiceNow ITOM | PagerDuty |
|---|---|---|---|---|---|
| Category | APM + AIOps + Observability | Observability + Security | Observability | ITSM + ITOM | Incident Management |
| MQ Position | Leader #1 | Leader #2 | Leader #3 | Leader (ITSM MQ) | Leader (ITOM MQ) |
| AI / AIOps | ★★★★★ | ★★★★☆ | ★★★★☆ | ★★★★☆ | ★★★★☆ |
| Full-stack coverage | ★★★★★ | ★★★★★ | ★★★★☆ | ★★★☆☆ | ★★★☆☆ |
| ITSM integration | ★★★★☆ | ★★★☆☆ | ★★★☆☆ | ★★★★★ | ★★★★☆ |
| Cloud-native support | ★★★★★ | ★★★★★ | ★★★★☆ | ★★★★☆ | ★★★★☆ |
| Open source / OTel | ★★★☆☆ | ★★★★☆ | ★★★★★ | ★★★☆☆ | ★★★☆☆ |
| Pricing model | Per host/DPM — complex | Per host/custom metrics | Consumption-based | Per user — expensive | Per user — tiered |
| Enterprise support | ★★★★★ | ★★★★☆ | ★★★☆☆ | ★★★★★ | ★★★★☆ |
| Best for | Complex enterprise, full-stack AI | Cloud-native, developer-led | Open-source flexible | ITSM-first, ServiceNow shops | Incident management, on-call |
What the MQ Doesn't Tell You
Choose Dynatrace if: You want the most mature, AI-driven full-stack observability platform with the least manual configuration. Dynatrace's automatic discovery and dependency mapping reduces time to value significantly. The pricing is premium but the reduction in operational overhead is real.
Choose Datadog if: Your organisation is cloud-native, developer-led, and values breadth of integrations over depth of AI automation. Datadog's 600+ integrations and strong developer experience make it the default choice for engineering-driven operations teams. Watch the cost carefully — Datadog bills can grow faster than expected.
Choose New Relic if: You want strong observability with a consumption-based pricing model and are committed to OpenTelemetry as your telemetry standard. New Relic's shift to a per-user model (rather than per-host) is distinctive and can be more economical at scale.
Choose ServiceNow ITOM if: You are already a ServiceNow ITSM customer and want to extend into operations. The CMDB and Event Management integration with ServiceNow's existing workflows creates genuinely differentiated value for ServiceNow-centric organisations.
Choose PagerDuty if: Incident management, on-call scheduling, and escalation are the primary problems to solve. PagerDuty integrates with all observability platforms and is the market leader for pure incident response workflow.
The Honest Assessment
The biggest mistake enterprises make in IT operations is buying observability tooling before establishing observability practices. Tools without instrumentation strategy, without defined SLOs, without on-call culture reform, and without runbook automation deliver a fraction of their potential value.
The organisations that extract genuine value from platforms like Dynatrace and Datadog have done three things first: they have instrumented their services properly (which is harder than it sounds), they have defined what good looks like (SLOs and error budgets), and they have restructured their on-call processes to act on what the tools surface.
The AIOps opportunity is real but requires patience. The initial implementation of any AIOps platform generates a period of learning — the models need data before they can suppress noise intelligently. Most organisations give up during this period. The ones that persist see compounding returns as the AI models improve.
What to Do Next
Three questions for IT leaders reviewing their operations strategy:
1. What is your mean time to detect and mean time to resolve for P1 incidents? If you cannot answer these precisely, measurement capability is your first investment.
2. What percentage of your monitoring alerts result in a human action? If the answer is less than 20%, you have an alert noise problem that AIOps can address.
3. Is your CMDB accurate enough to be trusted? Configuration management is the foundation of every ITOM capability — if your CMDB is out of date, every tool that depends on it will underperform.
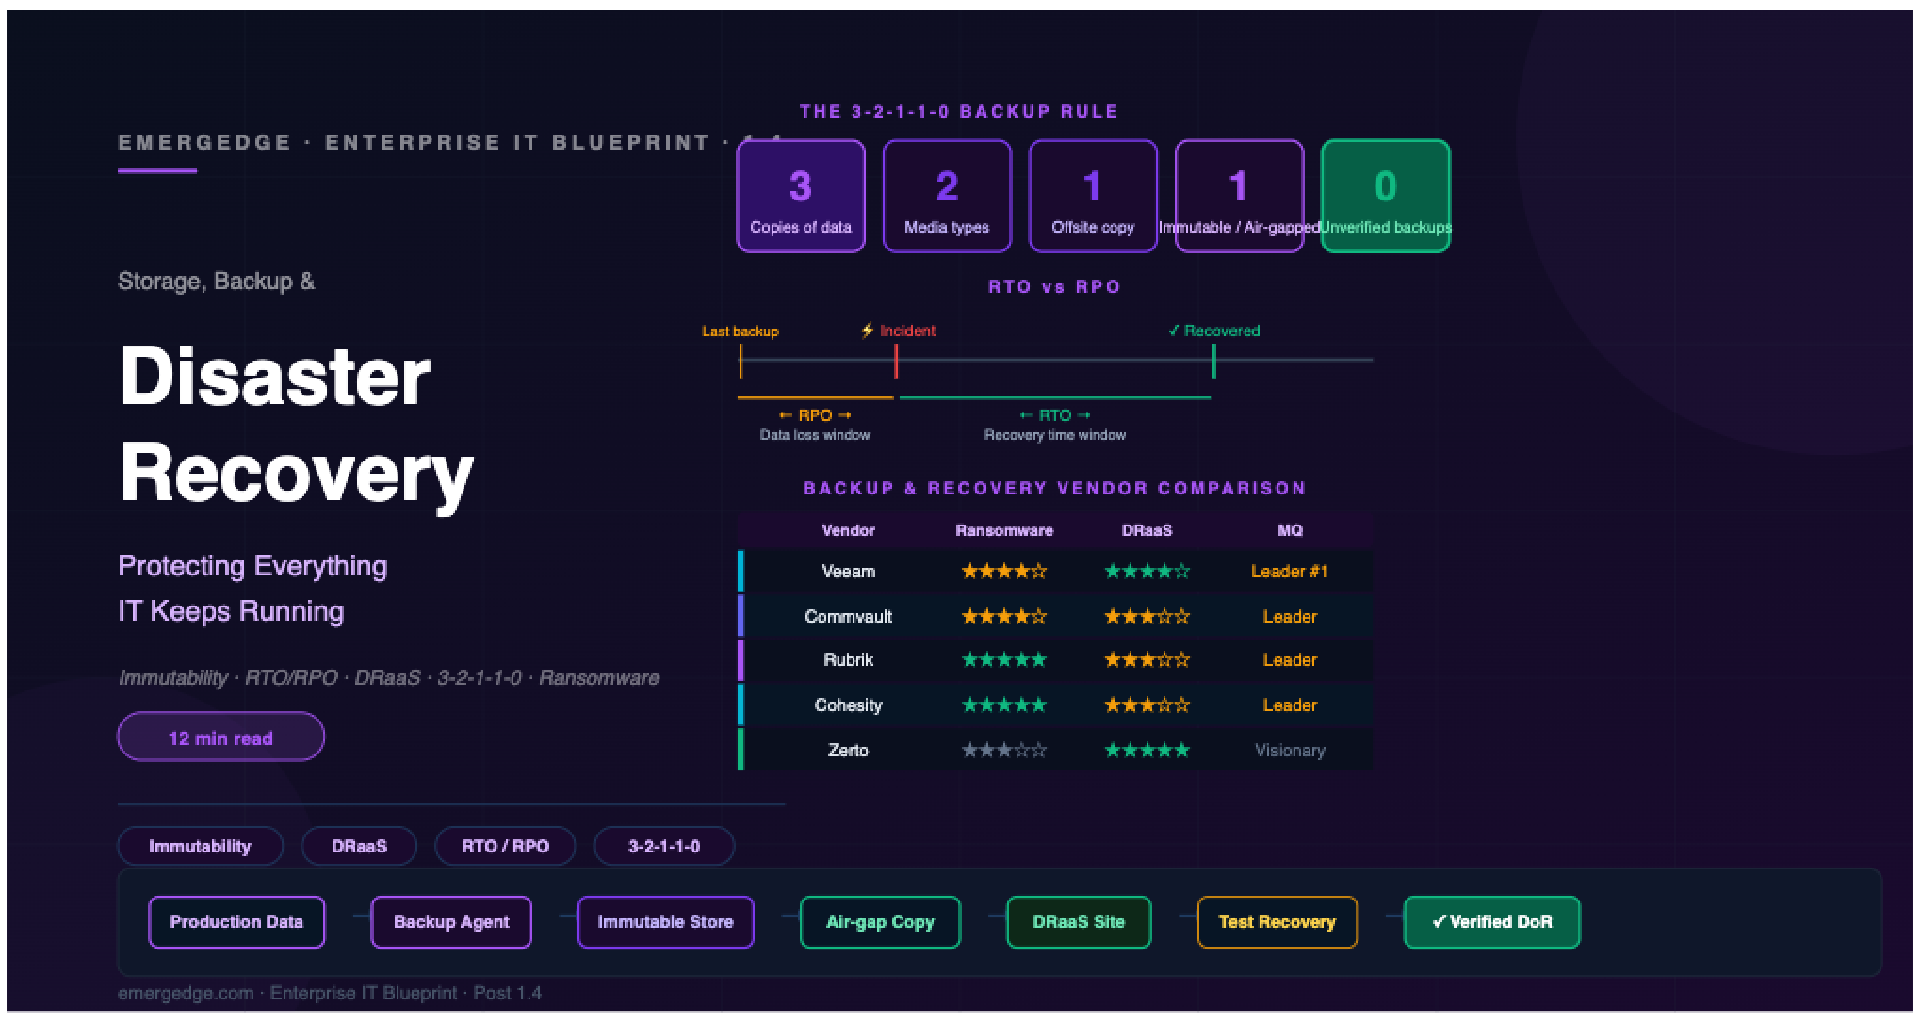
The next post in this category covers Storage, Backup, and Disaster Recovery — the persistence layer that protects everything operations keeps running.