A major retailer spent eighteen months implementing a market-leading BI platform. The implementation went smoothly. The dashboards were designed carefully, the data model was well-structured, and the platform was rolled out to two hundred business users across the organisation.
Six months after go-live, adoption surveys showed that fewer than forty percent of licensed users were accessing the platform regularly. Of those, the majority were using a small number of pre-built reports rather than building their own analyses. The anticipated reduction in ad-hoc data requests to the IT team had not materialised. The business was still making the same decisions the same way it had before the platform existed.
This story is not unusual. It is the norm.
Business intelligence platforms fail not because of the technology — the leading platforms are genuinely capable — but because organisations underinvest in the three things that determine whether BI delivers value: trusted underlying data, an analytical culture that rewards data-driven decision-making, and a self-service capability that puts insight in the hands of the people who can act on it.
The Modern BI Stack
Business intelligence is not a single platform. It is a stack — a sequence of layers, each dependent on the layers below it, that transforms raw operational data into business decisions.
The Data Warehouse and Data Lakehouse
The analytical data store is the foundation of the BI stack. It is where data from multiple source systems is integrated, transformed, and made available for analytical queries without impacting operational systems.
The traditional data warehouse — a relational database optimised for analytical queries with a structured schema — remains the right choice for well-defined, structured reporting requirements. Snowflake, Google BigQuery, and Amazon Redshift are the current enterprise standards, each offering a cloud-native, serverless model that eliminates the capacity planning and infrastructure management overhead of on-premises warehouse appliances.
The data lakehouse — combining the scalability and cost-efficiency of a data lake with the query performance and governance of a data warehouse — has emerged as the architecture of choice for organisations with diverse data types, AI/ML requirements, and the need to serve both analytical and data science workloads from a single platform. Databricks Delta Lake and the open table formats (Apache Iceberg, Apache Hudi) are the primary implementation approaches.
The Transformation Layer
Raw data arriving in the analytical store needs to be cleaned, structured, and modelled before it is suitable for BI consumption. dbt (data build tool) has become the de facto standard for this transformation layer — enabling analysts to write and manage SQL-based transformation logic with the software engineering practices (version control, testing, documentation) that data teams have historically lacked.
The Semantic Layer and Metrics Store
The semantic layer sits between the data model and the BI tool — providing a business-friendly translation of technical data structures into the concepts, metrics, and dimensions that business users understand. When consistently implemented, the semantic layer solves the "different numbers from different reports" problem by ensuring every tool that accesses the data uses the same metric definitions.
The metrics store — a newer architectural concept formalised by platforms like Cube, MetricFlow, and dbt Metrics — extends the semantic layer to provide a consistent, version-controlled definition of business metrics that can be consumed by any downstream tool, including BI platforms, AI models, and operational applications.
The BI and Visualisation Platform
The BI platform is the most visible layer of the stack — the tool that business users interact with directly. It provides the dashboards, reports, and self-service analytics capabilities that translate the underlying data into decisions.
The leading enterprise platforms — Microsoft Power BI, Tableau (Salesforce), Looker (Google), Qlik Sense, and Sisense — have converged significantly on core capabilities. The strategic differentiators in 2025 are AI-assisted analytics (natural language query, automated insight generation), embedded analytics (BI delivered within operational applications), and real-time analytics (dashboards connected to streaming data rather than batch-refreshed warehouses).
The Analytics Culture Problem
Technology is rarely the limiting factor in BI programmes. Culture almost always is.
Analytical culture refers to the organisational norms, behaviours, and incentives that determine whether people use data to make decisions or use data to justify decisions they have already made. The distinction is not trivial. An organisation where data is used to justify predetermined conclusions will extract far less value from its BI investment than one where data genuinely drives decisions — even when the two use identical technology.
The characteristics of a data-driven culture are consistent: leaders model analytical behaviour by asking "what does the data say?" before "what is my intuition?"; decision-making processes include explicit data requirements; and the organisation invests in analytical literacy across business functions, not just in the data team.
The organisational investment required to build this culture is significant and long-term. It cannot be delivered by a BI platform implementation project. It requires sustained leadership attention, investment in training, and a willingness to change decision-making processes — none of which appear in a BI vendor's product roadmap.
Self-Service Analytics — The Gap Between Promise and Reality
Every BI platform promises self-service analytics — the ability for business users to build their own analyses without depending on the IT or data team. The promise is compelling: it reduces the backlog of data requests, gets insight to decision-makers faster, and frees the data team to work on higher-value problems.
The reality is more complicated. Genuine self-service requires more than a user-friendly tool. It requires:
Data literacy. Business users need to understand enough about data structures, aggregation logic, and the limitations of their data to use self-service tools safely. A user who builds a report without understanding that sales figures exclude returns will share incorrect insights confidently.
A governed data model. Self-service works when the underlying data model is well-designed and well-documented. In organisations where data models are complex, undocumented, or inconsistent, self-service generates incorrect results that undermine trust.
A centre of excellence. The most successful self-service BI programmes are not simply "open access" — they are governed by a BI centre of excellence that defines standards, certifies datasets for self-service use, provides training, and maintains the boundary between governed reports and exploratory analysis.
The Gartner Magic Quadrant Landscape
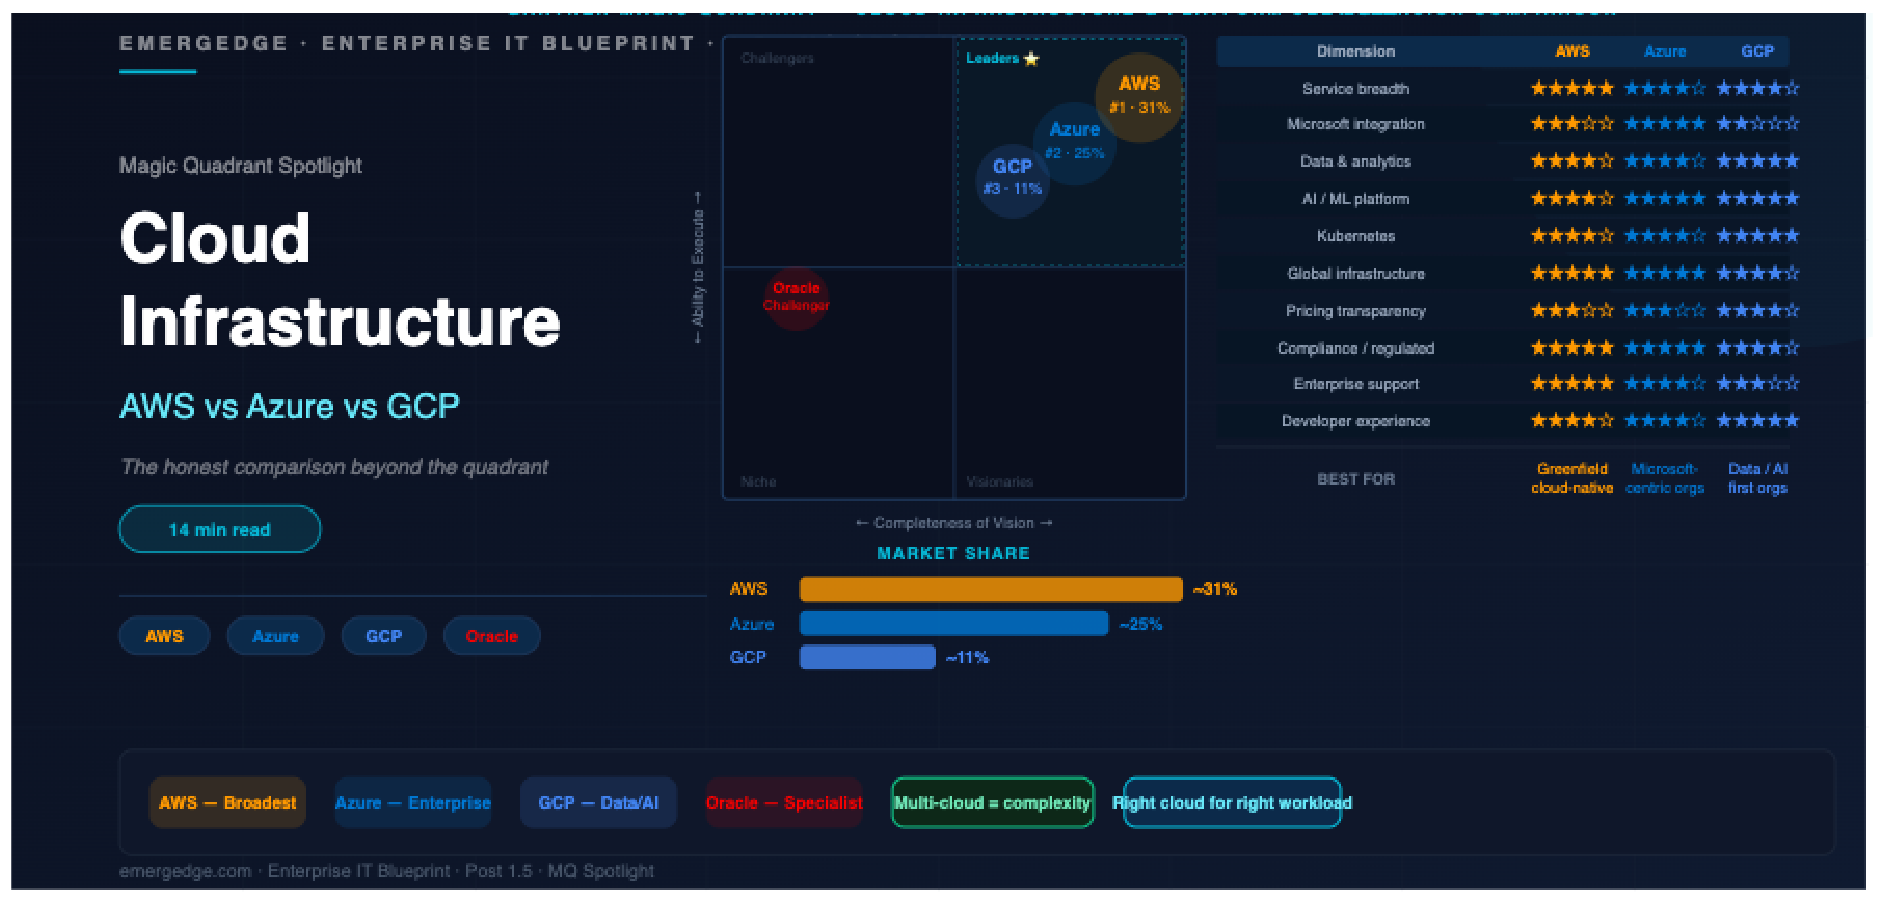
The Magic Quadrant for Analytics and Business Intelligence Platforms is one of Gartner's most-referenced quadrants. Microsoft Power BI and Tableau consistently occupy the top-right of the Leaders quadrant, with Qlik Sense and Looker also in the Leaders segment.
The defining differentiators between Leaders have shifted significantly in recent years from visualisation capability (now table stakes) to AI-assisted analytics, embedded analytics capability, and the breadth of the underlying data platform ecosystem.
Vendor Comparison
| Dimension | Microsoft Power BI | Tableau (Salesforce) | Looker (Google) | Qlik Sense | Sisense |
|---|---|---|---|---|---|
| MQ Position | Leader #1 | Leader #2 | Leader | Leader | Challenger |
| AI-assisted analytics | ★★★★★ | ★★★★☆ | ★★★★☆ | ★★★★☆ | ★★★★☆ |
| Self-service | ★★★★★ | ★★★★★ | ★★★☆☆ | ★★★★☆ | ★★★☆☆ |
| Embedded analytics | ★★★★☆ | ★★★★☆ | ★★★★★ | ★★★★☆ | ★★★★★ |
| Data modelling | ★★★★★ | ★★★☆☆ | ★★★★★ | ★★★★☆ | ★★★☆☆ |
| Microsoft integration | ★★★★★ | ★★★☆☆ | ★★★☆☆ | ★★★☆☆ | ★★★☆☆ |
| Mobile experience | ★★★★☆ | ★★★★☆ | ★★★☆☆ | ★★★★☆ | ★★★☆☆ |
| Total cost | ★★★★★ | ★★★☆☆ | ★★★☆☆ | ★★★☆☆ | ★★★★☆ |
| Best for | Microsoft shops, cost-conscious enterprise | Visual analytics, data culture | Google Cloud, embedded analytics | Associative analytics, data discovery | Embedded, product analytics |
What to Do Next
Three questions before the next BI investment:
1. What percentage of business decisions in your organisation are actually made using data rather than intuition or experience? If the number is below 50%, the constraint is not technology — it is culture, and no platform change will fix it.
2. Does your organisation have a single, agreed definition of its five most important business metrics — revenue, margin, customer count, churn rate, and NPS? If different functions would give different answers, the data model and governance issues will undermine any BI platform.
3. Who is responsible for the quality of the data that feeds your BI platform? If the answer is "the IT team", the wrong people own the problem. Business data quality is a business ownership issue.