The Gartner Magic Quadrant for Analytics and Business Intelligence Platforms is one of the most referenced documents in enterprise technology procurement. It is also one of the most frequently misapplied.
The mistake is familiar: an organisation uses the MQ to identify the Leaders, shortlists the top two or three, runs a proof of concept, and selects the platform with the highest scores in the evaluation criteria they defined. Twelve months later, adoption is disappointing. The platform technically works — but it does not work for the organisation.
The reason is almost always the same. The decision was made on the basis of platform capability rather than organisational fit. The questions that actually determine whether a BI platform succeeds — Who will use it? What data does it need to connect to? What is the analytical maturity of the business users? What is the organisation's cloud strategy? — were either asked too late or answered too optimistically.
This MQ Spotlight is designed to provide the analytical framework for asking those questions first.
Where the Leaders Sit
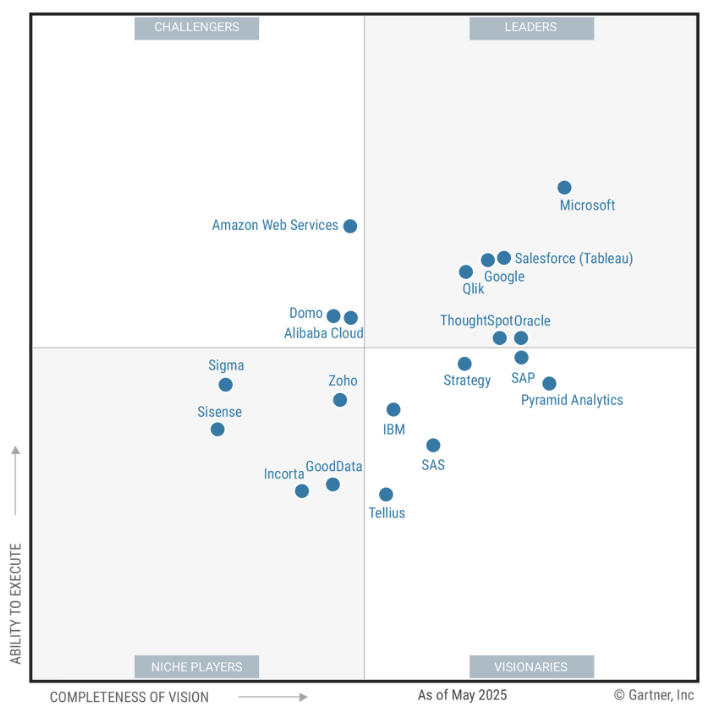
Microsoft Power BI
Power BI consistently holds the top position in Gartner's MQ for Analytics and BI Platforms — a position driven by a combination of product capability, pricing, and the unmatched distribution advantage of the Microsoft ecosystem.
Power BI's strategic position is simple: it is included in Microsoft 365 E3 and E5 licences at a cost point that makes it the default choice for any organisation already in the Microsoft ecosystem. The platform has matured dramatically since its early versions — the data modelling capability in Power BI Desktop (based on Analysis Services Tabular and DAX) is genuinely enterprise-grade, the semantic model is one of the strongest in the market, and the AI-assisted features (Copilot in Power BI, Q&A natural language query) are the most widely deployed enterprise AI analytics capability of any vendor.
Market share context: Power BI has approximately 250,000 organisations as customers globally — the largest installed base in the market by a significant margin.
Tableau (Salesforce)
Tableau built the modern data visualisation market and remains the benchmark for visual analytics design. The platform's strength is the drag-and-drop VizQL engine that allows non-technical users to create sophisticated visualisations intuitively — and the culture of data exploration it enables is genuinely differentiated.
The strategic question for Tableau in 2025 is Salesforce integration. The acquisition in 2019 has accelerated Tableau's data management capabilities (Tableau Data Management, Tableau Prep) and its connection to the Salesforce data ecosystem. For organisations with significant Salesforce CRM investment, Tableau's native Salesforce integration — including pre-built connectors and the ability to embed Tableau directly in Salesforce — is a meaningful differentiator.
Market share context: Approximately 85,000 customers globally, with significantly higher average deal size than Power BI, concentrated in mid-market and enterprise segments.
Looker (Google)
Looker is architecturally distinctive. Where Power BI and Tableau primarily connect to data stores and visualise the results, Looker's LookML semantic layer defines business logic centrally and queries data on-demand rather than extracting and caching it. This architectural choice has significant implications: Looker excels in organisations where consistency of metric definitions across the organisation is the primary governance concern, and where the data platform is Google BigQuery (for which Looker is the native BI tool).
The acquisition of Looker by Google in 2020 has integrated it deeply into the Google Cloud data platform. Looker Studio (the free, simplified version) has driven significant adoption, while Looker's enterprise platform serves the data-platform-first, SQL-native analytical community.
Best for: Google Cloud-centric organisations, data engineering-led analytics programmes, organisations with a metrics governance imperative.
The 12-Dimension Comparison
| Dimension | Power BI | Tableau | Looker | Qlik Sense | Sisense | Domo |
|---|---|---|---|---|---|---|
| MQ Position | Leader #1 | Leader #2 | Leader | Leader | Challenger | Challenger |
| Visual design quality | ★★★★☆ | ★★★★★ | ★★★☆☆ | ★★★★☆ | ★★★★☆ | ★★★★☆ |
| Self-service UX | ★★★★★ | ★★★★★ | ★★★☆☆ | ★★★★☆ | ★★★☆☆ | ★★★★☆ |
| Data modelling | ★★★★★ | ★★★☆☆ | ★★★★★ | ★★★★☆ | ★★★☆☆ | ★★★☆☆ |
| Semantic layer | ★★★★★ | ★★★☆☆ | ★★★★★ | ★★★★☆ | ★★★☆☆ | ★★★☆☆ |
| AI-assisted analytics | ★★★★★ | ★★★★☆ | ★★★★☆ | ★★★★☆ | ★★★★☆ | ★★★☆☆ |
| Embedded analytics | ★★★★☆ | ★★★★☆ | ★★★★★ | ★★★★☆ | ★★★★★ | ★★★★☆ |
| Mobile experience | ★★★★☆ | ★★★★☆ | ★★★☆☆ | ★★★★☆ | ★★★☆☆ | ★★★★★ |
| Microsoft integration | ★★★★★ | ★★★☆☆ | ★★★☆☆ | ★★★☆☆ | ★★★☆☆ | ★★★☆☆ |
| Salesforce integration | ★★★☆☆ | ★★★★★ | ★★★☆☆ | ★★★☆☆ | ★★★☆☆ | ★★★☆☆ |
| Google Cloud integration | ★★★☆☆ | ★★★☆☆ | ★★★★★ | ★★★☆☆ | ★★★☆☆ | ★★★☆☆ |
| Total cost of ownership | ★★★★★ | ★★★☆☆ | ★★★☆☆ | ★★★☆☆ | ★★★★☆ | ★★★☆☆ |
| Governance & certification | ★★★★★ | ★★★★☆ | ★★★★★ | ★★★★☆ | ★★★☆☆ | ★★★☆☆ |
The Decision Framework
Choose Power BI if:
Your organisation is Microsoft-centric — Microsoft 365, Azure, and the Power Platform are your primary productivity and data ecosystem. Power BI's cost advantage (often included in existing M365 licences), depth of integration with Teams, SharePoint, Azure Synapse, and the broader Microsoft fabric, and the breadth of the user community make it the lowest-friction enterprise BI path for most organisations. The introduction of Microsoft Fabric has further strengthened Power BI's position by tightly integrating it with the entire Microsoft data platform.
The honest caveat: Power BI's visual customisation is more constrained than Tableau. For organisations where data visualisation quality and design flexibility are primary requirements, Power BI may frustrate data-driven design teams.
Choose Tableau if:
Your organisation values data culture and visual analytics above all else. Tableau's community, the quality of its visualisations, and the drag-and-drop exploration experience create an analytical energy that drives adoption in a way that Power BI's more structured approach does not always replicate. Salesforce-centric organisations should give Tableau serious consideration for its native CRM integration.
The honest caveat: Tableau's cost is significantly higher than Power BI, and its data modelling capabilities — particularly the absence of a native semantic layer equivalent to Power BI's Analysis Services model — can become limiting at enterprise scale. Tableau's Hyper in-memory engine is fast, but complex enterprise data models often require more structural rigour than Tableau provides natively.
Choose Looker if:
Your organisation runs primarily on Google Cloud, has strong data engineering capability, and the consistency of metric definitions across the organisation is a governance priority. Looker's LookML semantic layer is the most rigorous approach to metrics governance of any platform in the market. For data-platform-first organisations where every analyst is comfortable with SQL, Looker's architectural choices are exactly right.
The honest caveat: Looker has a higher technical bar for implementation and maintenance than Power BI or Tableau. Business users who expect drag-and-drop self-service will find Looker less intuitive. And outside of the Google Cloud ecosystem, Looker's advantages over alternatives are less compelling.
Consider Qlik Sense if:
Associative data discovery — the ability to explore relationships across large datasets without predefined queries — is a primary requirement. Qlik's in-memory associative engine is genuinely differentiated for organisations doing exploratory analysis across complex, high-cardinality datasets. Strong in manufacturing, supply chain, and operational analytics use cases.
What the MQ Doesn't Show
The dimensions that most often determine BI platform success do not appear in any Magic Quadrant:
User adoption rate at 12 months. The most important BI metric is not capability — it is whether people actually use the platform. Adoption rates vary enormously across organisations using identical platforms. The difference is almost always cultural and organisational, not technological.
Time to trusted first report. How long does it take from data connection to a report that a business user trusts enough to make a decision with? This varies from days to months depending on data quality, modelling complexity, and governance maturity.
Self-service accuracy rate. What percentage of self-service reports contain correct information? In poorly governed environments, self-service produces more incorrect decisions than it prevents.
Three Questions Before Your Platform Decision
1. What is the primary use case — executive reporting, self-service analytics, or embedded analytics? Each use case favours different platforms. Confusing them leads to buying a platform optimised for the wrong job.
2. What is your data platform? The right BI platform is the one with the strongest native integration to where your data lives — Azure Fabric for Power BI, BigQuery for Looker, Salesforce for Tableau. Misaligning the BI platform and data platform creates integration overhead that undermines performance, governance, and total cost of ownership.
3. What is your organisation's analytical maturity? Power BI's self-service capability is most valuable in organisations with high analytical literacy. Looker's governance rigour is most valuable in organisations with strong data engineering. Tableau's visual power is most valuable in organisations that have built a data culture around visual exploration. Buying the wrong platform for your current maturity level sets adoption programmes up for failure before they start.